Commercial farms: meet your Net Zero strategy commitments
Two years ago, the Innovation Center for U.S. launched the Dairy Net Zero Initiative that will help U.S. dairy farms to achieve carbon neutrality and improve water use by 2050.
By promoting data collection and experimentation in dairy farms this initiative improves data analysis and measurement, and advances practices and technologies that reduce environmental impact in four key areas of dairy production which together represent the total footprint of dairy farms: feed production, enteric methane reduction, energy efficiency, and manure management.
However, whereas feed additives manufacturers provide estimates of their effects in terms of methane reduction, their efficacity can vary according to several external factors. This makes it difficult to assess them and justify their use in the context of Net Zero.
The Quantik service provides a verified method that can be used on a large scale to quantify enteric methane emissions in a quick and cost-effective way.
The 3 advantages of a scientific recognized method to quantify cow methane emission
In order to monitor the effect of their methane reduction strategy and be sure to meet their Net Zero strategy commitments, dairy farmers, milk procurement officers and sustainability managers need to actively benchmark and measure methane emissions over time with a quantitative method.
Until now the only methods to quantify and monitor cow methane emissions were labor intensive and expensive. Respiration chambers and sniffer systems are unsuitable for monitoring over time and over a large scale, and they are costly and time consuming.
Indirect estimations based on models relating diet quality with emissions are equations that require very precise information as inputs, which limit their ability to make accurate predictions.
On the contrary, Quantik does not require any equipment installation nor detailed data on diet composition to evaluate methane emissions. It makes the most of an already existing procedure, routine milk sampling, using a new technology allowing to quantify enteric methane in a quick and cost-effective way.
Its advantages make it the perfect solution for carbon accounting and reporting in the context of Net Zero strategy projects :
- It is based on a solid science-based technology that has been tested for over 10 years.
With Quantik, milk fatty acids are profiled during milk analysis and related to enteric methane emissions through a scientific model. The link between milk fatty acids and enteric methane has been investigated since 2009 and the equations precisely quantifying this relationship have been patented in the US.
- It has been recognized internationally as a carbon accounting tool.
In Europe it is an approved method by the Low Carbon French Label, as a tool for carbon credit generation. It is equally recognized by the UNFCCC (United Nations Framework Convention on Climate Change) and it is compliant with the IPCC protocol for carbon accounting.
- It has a global validity.
As it is based on cow physiology and metabolism rather than environmental factors that can depend on farm location, it can be applied all over the world without losing its accuracy.
Make the most of your milk sampling routine: Quantik is easy and not time-consuming
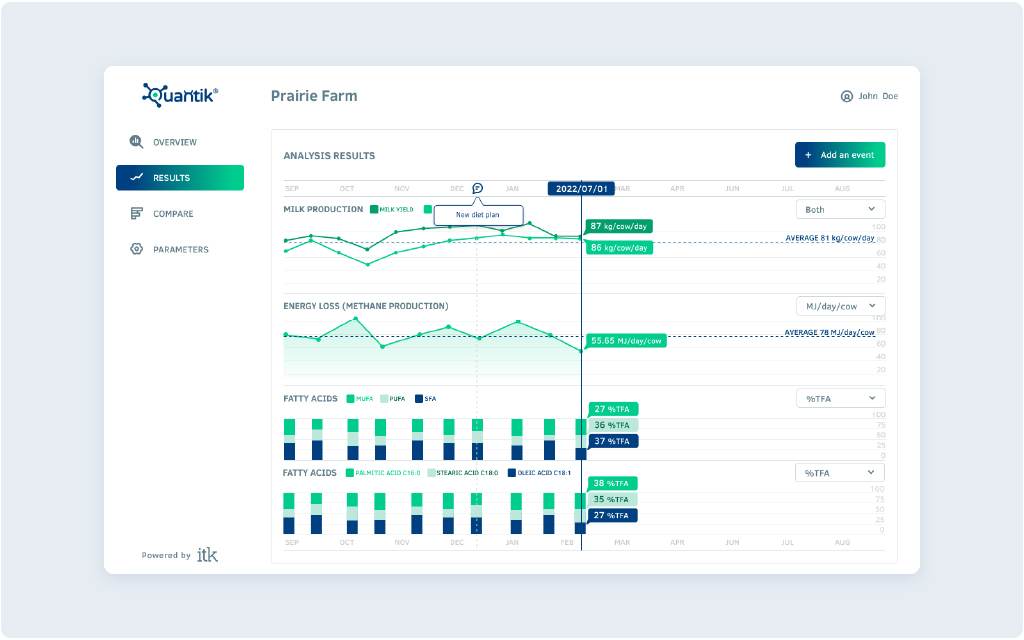
Quantik takes advantage of milk analysis that are done routinely in dairy farms. Fatty acids levels are easily obtained and used to calculate enteric methane emissions through a verified and patented model. Methane emissions dynamics are automatically displayed in easy-to-read graphs that allow to benchmark their levels, and to assess and eventually improve the Net Zero strategy measures adopted by farms. According to projects requirements, milk samples can be taken from individual cows or from collective milk tanks, to estimate individual or average emissions. For all these reasons, Quantik is easy to implement, demand minimal time, and can be easily scaled to all farms of a supply shed.
4 steps to get the best quality daya out of Quantik Dairy Sustainability platform
Start measuring now, to reduce cattle emissions.
Mesure.
- Determine a baseline
- Quantify the cow enteric methane emissions for each of your dairy commercial farms with a simple milk analysis to establish a baseline.
Plan.
- Define a mitigation plan
- Benchmarking with similar farms will help you establish the best carbon curbing strategies.
- Choose the most efficient cow diet & feed additive actions according to their impact and feasability.
Reduce.
- Monitor reductions progress
- Reduction levers simulation
- Observe in time the benefits of your mitigation measures
- Access to a accredited laboratories network
Report impact.
- Data collection and integration
- Avail of objective, scientific-based indicators to quantify your GHG reduction in your ESG reporting.
Greenhouse gases are emitted through the production and consumption of goods and services. In the context of climate change, the term ‘Carbon footprint’ has become a widely used “buzzword” peppering public debate. By this expression, we indicate the total amount of greenhouse gases (including carbon dioxide and methane) that are generated by any given human activity, by individuals or groups of them, or countries.
The agriculture carbon footprint
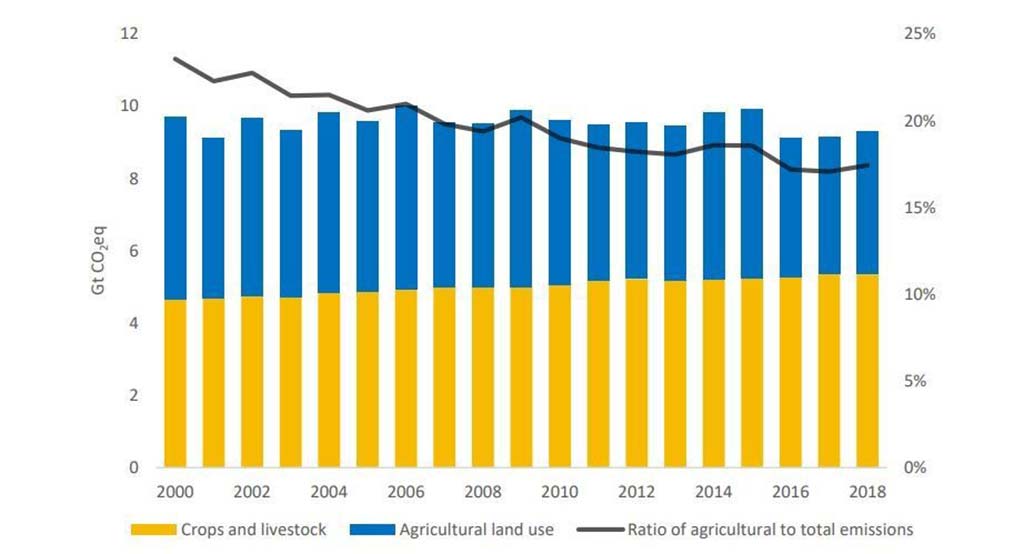
On the global level, the “agriculture, forestry and other land use” sector is responsible for 23% of anthropogenic greenhouse gas emissions, i.e. 12 Gigatonnes CO2 equivalent/year. Most of these emissions are due to either agricultural emissions of methane and nitrous oxide (N2O) from nitrogen fertilization or to land use changes and deforestation, which release 5.2 Gt of carbon dioxide (CO2) per year. Whereas the percentage of the global carbon footprint attributed to agriculture has decreased over the last decades, in absolute terms emission from crops and livestock activities have kept growing non-stop. According to FAO, during the 2000–2018 period GHG emissions have raised by 14 percent, mainly due to an increase in farm activities and to land use changes. With the increase in global population and the consequent increasing food needs, there is a clear potential for further increase of agricultural GHG emissions in the near future.
To identify potential carbon curbing measures in agriculture, it is useful to understand more about the sources and types of GHG in this sector. Within the food production chain crop production, land use and the supply chain account respectively for 27%, 24% and 18% of total emissions. But the biggest contributor to the carbon footprint of this sector are livestocks and fisheries (31%).
Yearly emissions from crops and livestock and related land use, and share of agriculture in global GHG emissions from all sectors, 2000-2018
The warming potential of methane
Indeed, a lot of the emissions from livestock are made up by methane, which is considered as a much more powerful greenhouse gas than CO2. Methane has a much shorter atmospheric lifetime than CO2 (around 12 years compared with centuries for CO2), but it is a much more potent greenhouse gas, absorbing much more energy while it exists in the atmosphere.
According to the Intergovernmental Panel on Climate Change (IPCC) the warming potential of methane is between 84-87 times that of CO2 when considering its impact over a 20-year timeframe (GWP20) and between 28-36 when considering its impact over a 100-year timeframe (GWP100). This means that one tonne of methane can considered to be equivalent to 28 to 36 tonnes of CO2 if looking at its impact over 100 years (the warming potential of methane over time is 28 times that of CO2).
For this reasons measures acting to curb methane production from livestock will be particularly effective in reducing the carbon footprint of agriculture.
How much methane do cows produce?
Ruminant livestock can produce 250 to 500 L of methane per day. This methane mainly derives from:
- enteric methane production: microbial activity in the rumen breaking down fibers and nutrients
- manure fermentation.
This level of production results in estimates of the contribution by cattle to global warming that may occur in the next 50 to 100 yr to be a little less than 2%.
Decreasing the carbon footprint of the dairy sector
As dairy producers look for solutions to decrease greenhouse gas emissions, questions arise. How does basic nutrition and feeding of cows affect GHG emissions on the farm? How can nutrition and other factors be used to control methane production? How do we mesure emission to monitor the effectiveness of our management measures?
Research shows that many factors influence methane emissions from cattle and they can be manipulated to decrease it:
- Type of diet carbohydrates: GHG production can be related to diet or ration type as well as level of dry matter intake. dairy diets are largely forage- or fiber-based, whereas feedlot cattle consume a predominantly starch-based diet. Research has shown that on a total amount of GHG produced per head, dairy cattle with higher dry matter intake and higher fiber intake produce more GHG. So diet type has a direct effect.
- Feed additives and ionophores: Several feed additives have been identified and are being developed to reduce GHG and potentially improve rumen function. Some additives include enzymes (especially fibrolytic enzymes), yeasts and other direct- fed microbials and plant extracts. Many of these have been initially identified as a means of improving diet digestibility and increasing feed efficiency. An example is Rumensin, which has long been known to improve rumination efficiency in beef and dairy diets. This additive has been shown to reduce methane, ammonia and other gases produced during the rumination process.
- Ruminal microflora: Recent findings show that the composition of the rumen microbial community is directly associated with the quantity of methane produced by rumination. Feed complements that can alter ruminal microflora to decrease methane production are being presently studied.
Measuring the dairy industry carbon footprint
Regardless of the mitigation strategy imposed, any reduction in enteric methane production must be quantified and for this to be achieved, as accurate baseline emissions data are essential.
Enteric methane production can be measured or estimated through different methods:
Direct measurements
Respiration chambers are considered the ‘Gold Standard’ to measure methane emission. A single animal (or occasionally more) is confined in a chamber for between 2 and 7 days. Concentration of methane (and other gases if required) is measured at the air inlet and outlet vents of the chamber. Hovewer they are unsuitable for monitoring over time and for large scale measurements and they are costly and time consuming.
GreenFeed is a sniffer system where breath samples are provided when animals visit a bait station. It samples breath from individual animals several times per day for short periods (3 to 7 min). Methane emission is estimated as a flux at each visit. It has the advantage of being a portable standalone system that can used in barns and pastures, but the limitation that animals require training to use the system, and that it cannot be used for large scale monitoring over time.
Indirect estimations
Intake and diet quality (digestibility), can be used to make indirect estimations of the amount of methane emitted during rumination. Different calculations are available for this, although not always precise. Indeed, the assumptions and conditions that must be met for these models limit their ability to make accurate predictions. Diet quality can be obtained through lab analysis of samples of the rations or pasture consumed, and the amount of food intake should also be measured or estimated with precision to get good estimates.
One expert proxy for the prediction of CH4 production is the concentration of fatty acids in milk. These compounds can be determined by mid-infrared spectroscopy during milk analysis, and their concentration can be used to calculate estimates of methane emissions during rumination. These estimations have shown to be accurate and have a good potential as tools for herd monitoring.
The Quantik solution offers an innovative service for methane monitoring in your herd based on the measurement of milk fatty acid concentration.